
Natural Gas Price Analysis: XNG/USD retreats from 200-SMA within weekly rising wedge Gas Energy Commodities Technical Analysis ChartPatterns
In doing so, the asset also eases within a one-week-old rising wedge bearishApart from the 200-SMA and rising wedge, the nearly overbought RSI line also teases the Natural Gas sellers.
During the anticipated downside, the previous resistance line from May 26, close to $2.32 at the latest, can act as an extra filter towards the north. On the contrary, an upside break of the 200-SMA hurdle of $2.40 needs validation from the stated wedge’s top line surrounding $2.43 to convince the XNG/USD bulls.
If not otherwise explicitly mentioned in the body of the article, at the time of writing, the author has no position in any stock mentioned in this article and no business relationship with any company mentioned. The author has not received compensation for writing this article, other than from FXStreet.
South Africa Latest News, South Africa Headlines
Similar News:You can also read news stories similar to this one that we have collected from other news sources.
 Natural Gas Price Analysis: 200-EMA remains a key barrierNatural Gas (XNG/USD) price is demonstrating a back-and-forth action around $2.30 in the London session. The energy instrument is struggling to find a
Read more »
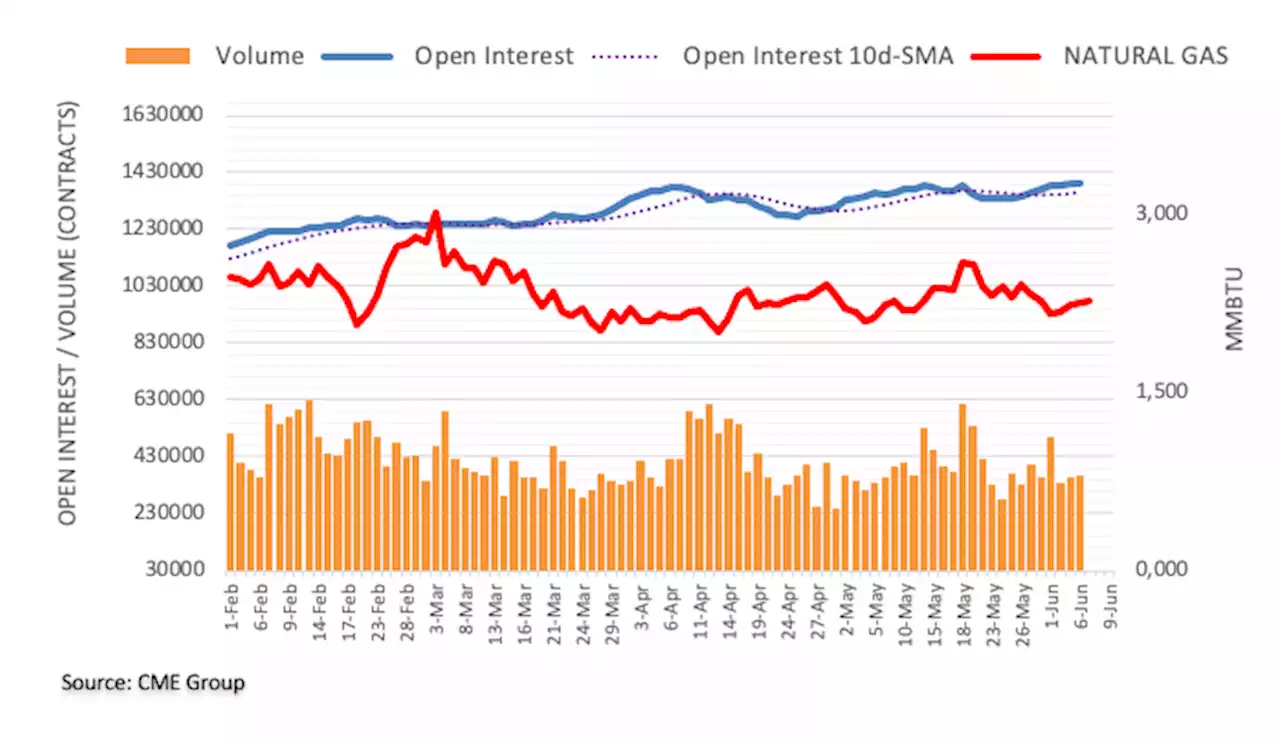
 Natural Gas Futures: Scope for further gains near termConsidering advanced prints from CME Group for natural gas futures markets, open interest resumed the uptrend and went up by around 5.1K contracts on
Read more »
 Freak accident involving natural gas tank destroys 2 homes in ChannelviewThe tank landed 900 feet away in a neighbor's home, leaving a crater in the roof and floor. Officials say they're amazed no one was hurt.
Read more »
 Natural Gas Futures: Scope for extra gainsConsidering advanced prints from CME Group for natural gas futures markets, open interest increased for the second session in a row on Tuesday, now by
Read more »
 Natural Gas Forecast: Continues to See Major HeadwindsNatural gas markets experienced a minor setback during Tuesday\u0027s trading session.
Read more »
 USD/JPY Price Analysis: Bearish triangle highlights 139.30 for Yen tradersUSD/JPY extends previous day’s fall within one-week-old bearish chart formation. Sustained trading below 100-EMA, bearish MACD signals favor Yen pair
Read more »